📑 Exercise 2.6 – Question Navigation
Jump directly to any question and view its complete step-by-step NCERT solution with clear explanations and graphs.
📘 About Exercise 2.6
These Class 9 Maths Chapter 2 Exercise 2.6 Solutions explain how the graph of a linear equation changes when the values of a and b change. In this exercise, you will draw graphs, compare straight lines, understand slopes, identify y-intercepts, and observe parallel lines using the latest NCERT Ganita Manjari (2026) and CBSE approach.
Locate ordered pairs accurately on the Cartesian plane.
Prepare a table of values and draw straight-line graphs.
Learn the role of slope, y-intercept and parallel lines.
✨ What You Will Understand in This Exercise
- Draw the graph of a linear equation using a table of values.
- Plot ordered pairs correctly on the Cartesian plane.
- Observe how changing a changes the slope of the graph.
- Understand how changing b shifts the graph without changing its slope.
- Identify parallel lines by comparing their graphs.
- Build a strong foundation for graph-based questions in higher classes.
📖 Before You Start Drawing Graphs
Exercise 2.6 is different from the previous exercises. Here, you will not only solve equations but also visualise linear relationships by drawing graphs on the Cartesian plane. Every graph represents a linear equation, and every point plotted on the graph satisfies that equation.
Before solving the questions, it is helpful to understand how a straight-line graph is formed and what information it provides. Once these concepts are clear, drawing graphs becomes much easier.
An equation like y = 2x + 1 represents a straight line. By finding a few values of x and the corresponding values of y, we obtain points that lie on the graph.
Each pair (x, y) is called an ordered pair. After plotting these ordered pairs on the Cartesian plane, joining them with a ruler gives the required straight-line graph.
If the graph rises from left to right, it has a positive slope. If it falls from left to right, it has a negative slope.
The value of b in the equation y = ax + b tells where the graph cuts the y-axis. Changing only b shifts the graph upward or downward.
Graphs having the same value of a but different values of b are parallel because they have the same slope but different y-intercepts.
A straight line is completely determined by two distinct points. However, plotting three or more points helps verify that the graph has been drawn correctly.
Quick Steps to Draw Any Linear Graph
- Write the given linear equation.
- Choose suitable values of x.
- Find the corresponding values of y.
- Prepare a table of values.
- Plot all ordered pairs on the Cartesian plane.
- Join the plotted points using a ruler.
- Extend the line on both sides and label the graph.
- ✔ Every linear equation represents a straight line.
- ✔ Larger positive values of a produce steeper graphs.
- ✔ Negative values of a produce downward-sloping graphs.
- ✔ Changing only b moves the graph up or down.
- ✔ Graphs with the same slope remain parallel.
- ✔ Every plotted point must satisfy the given equation.
Class 9 Maths Chapter 2 Exercise 2.6 Solutions (Step-by-Step)
Question 1 (i)
Draw the graphs of the following sets of lines. In each case, reflect on the role of ‘a’ and ‘b’.
y = 4x, y = 2x, y = x
📌 Given
y = ax + b
- a represents the slope (inclination) of the line.
- b represents the y-intercept.
- For all the given equations, b = 0.
🎯 To Find
- Draw the graphs of the given equations.
- Observe the role of a and b.
🟧 Step 1 : Prepare the Tables of Values
Choose suitable values of x and calculate the corresponding values of y for each equation. These ordered pairs will be used to draw the graphs.
Table for y = 4x
| x | −2 | −1 | 0 | 1 | 2 |
| y | −8 | −4 | 0 | 4 | 8 |
Table for y = 2x
| x | −2 | −1 | 0 | 1 | 2 |
| y | −4 | −2 | 0 | 2 | 4 |
Table for y = x
| x | −2 | −1 | 0 | 1 | 2 |
| y | −2 | −1 | 0 | 1 | 2 |
The ordered pairs obtained from the above tables will now be plotted on the Cartesian plane to draw the required graphs.
🟧 Step 2 : Plot the Points and Draw the Graphs
Plot the ordered pairs from the above tables on the Cartesian plane. Join the corresponding points using a ruler to obtain straight-line graphs and extend each line in both directions.
The graphs of y = 4x, y = 2x and y = x are shown below.
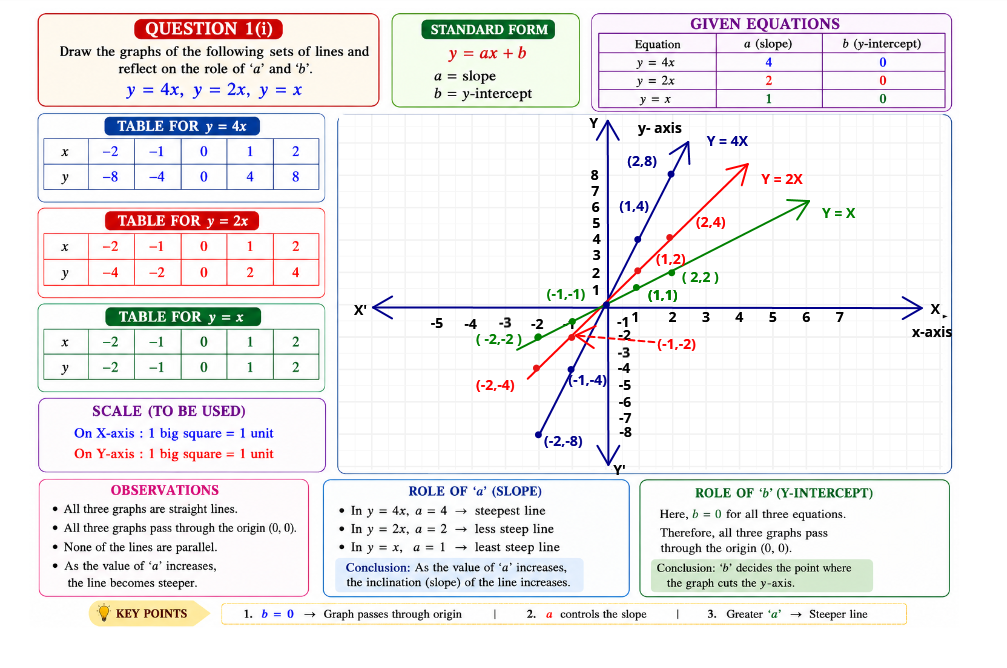
Figure: Graphs of y = 4x, y = 2x and y = x showing the effect of the slope (a) when b = 0.
🟧 Step 3 : Observe the Graphs
From the graphs, we observe the following.
- All three graphs are straight lines.
- All three graphs pass through the origin (0,0).
- None of the graphs are parallel because their slopes are different.
- The graph of y = 4x is the steepest.
- The graph of y = 2x is less steep than y = 4x.
- The graph of y = x is the least steep.
📊 Comparison of the Given Equations
| Equation | Slope (a) | Direction | Steepness |
|---|---|---|---|
| y = 4x | 4 | Upward | Greatest |
| y = 2x | 2 | Upward | Moderate |
| y = x | 1 | Upward | Least |
💡 Reflection on the Role of ‘a’ and ‘b’
From the graphs, we conclude the following.
- The value of a determines the slope (inclination) of the graph.
- As the value of a increases, the graph becomes steeper.
- All the given values of a are positive, so every graph rises from left to right.
- The value of b determines the y-intercept of the graph.
- Since b = 0 for all the given equations, every graph passes through the origin (0,0).
✅ Final Answer
- The value of a determines the slope (inclination) of the graph.
- As the value of a increases, the graph becomes steeper.
- The value of b determines the y-intercept of the graph.
- Since b = 0 for all the given equations, every graph passes through the origin (0,0).
- The graphs of y = 4x, y = 2x and y = x are straight lines having different slopes but the same y-intercept.
📘 Key Concept Used
In the linear equation y = ax + b, the coefficient a determines the slope (inclination) of the graph, whereas the constant b determines the y-intercept. If a is positive, the graph rises from left to right. When b = 0, the graph always passes through the origin.
⚠ Common Mistake
Many students think that increasing the value of a shifts the graph upward. Actually, changing a changes only the slope (steepness) of the graph. The graph shifts upward or downward only when the value of b changes.
🎯 Exam Tip
Always prepare a table of values before plotting the graph. Plot at least three correct points, join them using a ruler to obtain a straight line, and verify the y-intercept before drawing the final graph.
🧠 Graph Memory Trick
- a > 0 → Graph rises from left to right ↗
- Larger value of a → Steeper graph.
- b = 0 → Graph always passes through the origin (0,0).
- Different values of a produce different slopes.
Question 1 (ii)
Draw the graphs of the following sets of lines. In each case, reflect on the role of ‘a’ and ‘b’.
y = –6x, y = –3x, y = –x
📌 Given
y = ax + b
- a represents the slope (inclination) of the line.
- b represents the y-intercept.
- For all the given equations, b = 0.
🎯 To Find
- Draw the graphs of the given equations.
- Observe the role of a and b.
🟧 Step 1 : Prepare the Tables of Values
Choose suitable values of x and calculate the corresponding values of y for each equation. These ordered pairs will be used to draw the graphs.
Table for y = –6x
| x | −2 | −1 | 0 | 1 | 2 |
| y | 12 | 6 | 0 | −6 | −12 |
Table for y = –3x
| x | −2 | −1 | 0 | 1 | 2 |
| y | 6 | 3 | 0 | −3 | −6 |
Table for y = –x
| x | −2 | −1 | 0 | 1 | 2 |
| y | 2 | 1 | 0 | −1 | −2 |
The ordered pairs obtained from the above tables will now be plotted on the Cartesian plane to draw the required graphs.
🟧 Step 2 : Plot the Points and Draw the Graphs
Plot the ordered pairs obtained from the above tables on the Cartesian plane. Join the corresponding points using a ruler to obtain straight-line graphs and extend each line in both directions.
The graphs of y = –6x, y = –3x and y = –x are shown below.
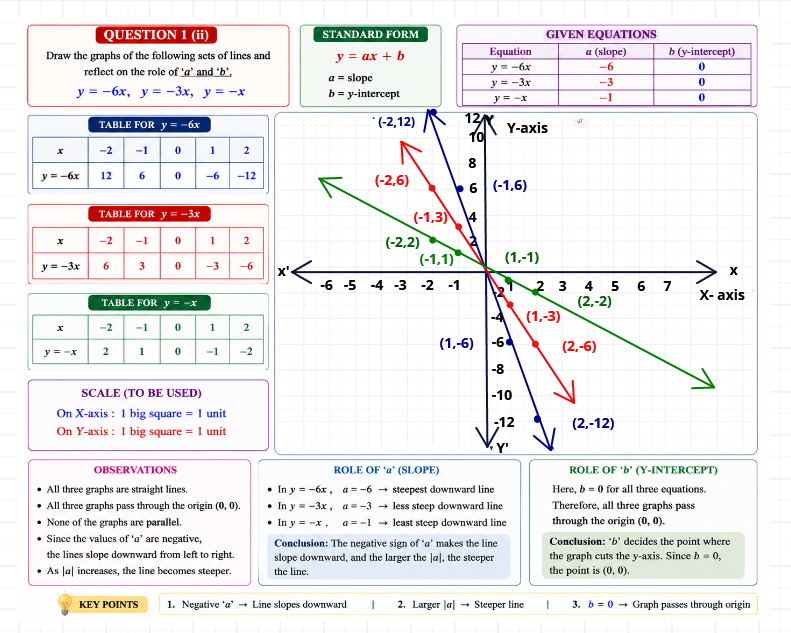
Figure: Graphs of y = –6x, y = –3x and y = –x showing the effect of a negative slope when b = 0.
🟧 Step 3 : Observe the Graphs
From the graphs, we observe the following.
- All three graphs are straight lines.
- All three graphs pass through the origin (0,0).
- None of the graphs are parallel because their slopes are different.
- Since the values of a are negative, all the graphs slope downward from left to right.
- The graph of y = –6x is the steepest downward line.
- The graph of y = –3x is less steep than y = –6x.
- The graph of y = –x is the least steep downward line.
📊 Comparison of the Given Equations
| Equation | Slope (a) | Direction | Steepness |
|---|---|---|---|
| y = –6x | –6 | Downward | Greatest |
| y = –3x | –3 | Downward | Moderate |
| y = –x | –1 | Downward | Least |
💡 Reflection on the Role of ‘a’ and ‘b’
From the graphs, we conclude the following.
- The value of a determines both the slope and the direction of the graph.
- Since a is negative for all the given equations, every graph slopes downward from left to right.
- The greater the numerical value of |a|, the steeper the downward graph.
- The value of b determines the y-intercept of the graph.
- Since b = 0 for all the given equations, every graph passes through the origin (0,0).
✅ Final Answer
- The value of a determines the slope as well as the direction of the graph.
- Since a is negative for all the given equations, every graph slopes downward from left to right.
- As the numerical value of |a| increases, the graph becomes steeper.
- The value of b determines the y-intercept of the graph.
- Since b = 0 for all the given equations, every graph passes through the origin (0,0).
📘 Key Concept Used
In the equation y = ax + b, the coefficient a determines the slope and direction of the graph, while b determines the y-intercept. A negative value of a produces a graph that slopes downward from left to right. If b = 0, the graph always passes through the origin.
⚠ Common Mistake
Students often think that a negative value of a changes the y-intercept of the graph. Actually, it changes only the direction and steepness of the graph. The y-intercept depends only on the value of b.
🎯 Exam Tip
Always prepare a table of values before plotting the graph. Plot at least three correct points and verify whether the graph passes through the correct y-intercept. When b = 0, the graph must pass through the origin.
🧠 Graph Memory Trick
- a < 0 → Graph falls from left to right ↘
- Larger value of |a| → Steeper downward graph.
- b = 0 → Graph always passes through the origin (0,0).
- Different negative values of a produce different downward slopes.
Question 1 (iii)
Draw the graphs of the following sets of lines. In each case, reflect on the role of ‘a’ and ‘b’.
y = 5x, y = –5x
📌 Given
y = ax + b
- a represents the slope (inclination) of the line.
- b represents the y-intercept.
- For both the given equations, b = 0.
🎯 To Find
- Draw the graphs of the given equations.
- Compare the two graphs.
- Reflect on the role of a and b.
🟧 Step 1 : Prepare the Tables of Values
Choose suitable values of x and calculate the corresponding values of y for each equation. These ordered pairs will be used to draw the graphs.
Table for y = 5x
| x | −2 | −1 | 0 | 1 | 2 |
| y | −10 | −5 | 0 | 5 | 10 |
Table for y = –5x
| x | −2 | −1 | 0 | 1 | 2 |
| y | 10 | 5 | 0 | −5 | −10 |
Using the above tables, plot the ordered pairs on the Cartesian plane and draw the required graphs.
🟧 Step 2 : Plot the Points and Draw the Graphs
Plot the ordered pairs obtained from the above tables on the Cartesian plane. Join the corresponding points using a ruler to obtain straight-line graphs and extend each line in both directions.
The graphs of y = 5x and y = –5x are shown below.
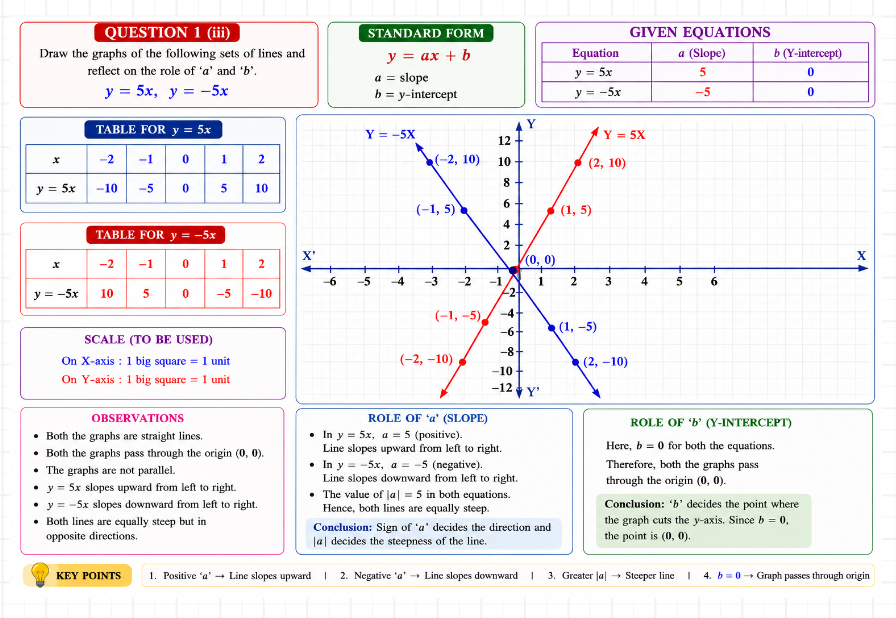
Figure: Graphs of y = 5x and y = –5x showing equal slopes in magnitude but opposite directions.
🟧 Step 3 : Observe and Compare the Graphs
From the graphs, we observe the following.
- Both graphs are straight lines.
- Both graphs pass through the origin (0,0).
- The graphs are not parallel because their slopes are different.
- The graph of y = 5x rises upward from left to right.
- The graph of y = –5x slopes downward from left to right.
- Both lines are equally steep because the numerical value of the slope is the same (|5| = |-5|).
📊 Comparison of the Given Equations
| Equation | Slope (a) | Direction | Steepness |
|---|---|---|---|
| y = 5x | 5 | Upward | Same |
| y = –5x | –5 | Downward | Same |
💡 Reflection on the Role of ‘a’ and ‘b’
From the graphs, we conclude the following.
- The value of a determines both the slope and the direction of the graph.
- If two equations have the same numerical value of a, their graphs are equally steep.
- If the signs of a are opposite, one graph rises while the other falls.
- The value of b determines the y-intercept.
- Since b = 0 in both equations, both graphs pass through the origin (0,0).
✅ Final Answer
- Both graphs are straight lines passing through the origin (0,0).
- The values of a are 5 and –5, so both graphs have the same steepness.
- The positive value of a makes the graph rise from left to right, whereas the negative value of a makes the graph fall from left to right.
- Since b = 0 in both equations, both graphs pass through the origin.
📘 Key Concept Used
In the equation y = ax + b, the numerical value of a determines the steepness of the graph, while the sign of a determines its direction. A positive value of a produces an upward-sloping line, whereas a negative value produces a downward-sloping line. The value of b determines the y-intercept.
⚠ Common Mistake
Students often think that the graphs of y = 5x and y = -5x have different steepness because one rises and the other falls. Actually, both graphs are equally steep; only their directions are opposite because the signs of a are different.
🎯 Exam Tip
Whenever two equations have the same numerical value of a, compare their signs. If the signs are opposite, the graphs will be equally steep but slope in opposite directions.
🧠 Graph Memory Trick
+a ↗ Graph Rises
−a ↘ Graph Falls
|a| Same
⇒
Same Steepness
Question 1 (iv)
Draw the graphs of the following sets of lines. In each case, reflect on the role of ‘a’ and ‘b’.
y = 3x – 1, y = 3x, y = 3x + 1
📌 Given
y = ax + b
- a represents the slope (inclination) of the line.
- b represents the y-intercept of the graph.
- For all the given equations, a = 3.
- The values of b are –1, 0 and 1.
🎯 To Find
- Draw the graphs of the given equations.
- Compare the three graphs.
- Observe the effect of changing the value of b.
🟧 Step 1 : Prepare the Tables of Values
Choose suitable values of x and calculate the corresponding values of y for each equation. These ordered pairs will be used to plot the graphs.
Table for y = 3x – 1
| x | −1 | 0 | 1 | 2 |
| y | −4 | −1 | 2 | 5 |
Table for y = 3x
| x | −1 | 0 | 1 | 2 |
| y | −3 | 0 | 3 | 6 |
Table for y = 3x + 1
| x | −1 | 0 | 1 | 2 |
| y | −2 | 1 | 4 | 7 |
Using the above tables, plot the ordered pairs on the Cartesian plane and draw the three straight lines.
🟧 Step 2 : Plot the Points and Draw the Graphs
Plot the ordered pairs obtained from the above tables on the Cartesian plane. Join the corresponding points using a ruler to obtain straight-line graphs and extend each line in both directions.
The graphs of y = 3x – 1, y = 3x and y = 3x + 1 are shown below.
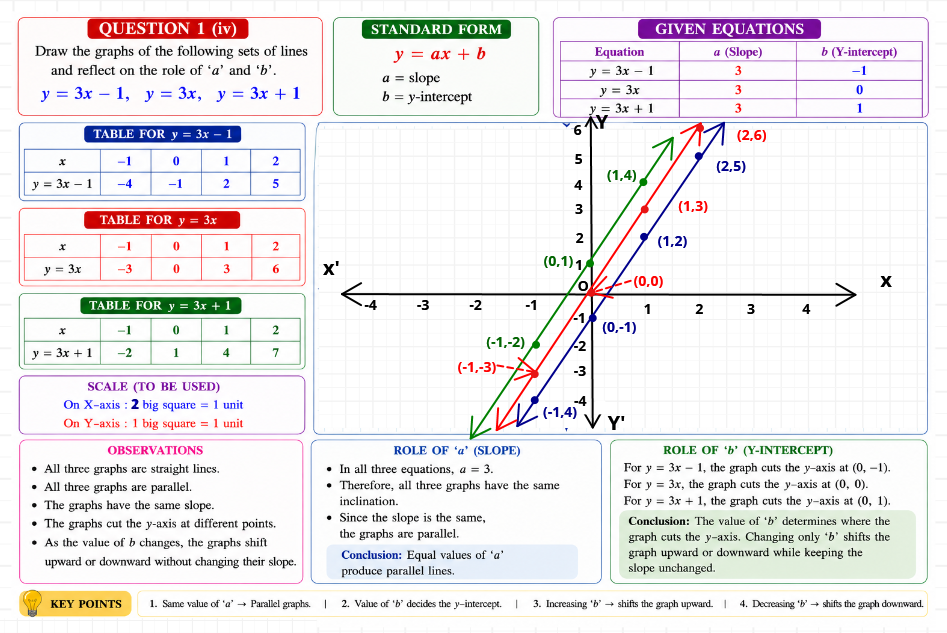
Figure: Graphs of y = 3x – 1, y = 3x and y = 3x + 1 showing the effect of changing the value of b while keeping the slope constant.
🟧 Step 3 : Observe and Compare the Graphs
From the graphs, we observe the following.
- All three graphs are straight lines.
- All three graphs have the same slope.
- The graphs are parallel to one another.
- Each graph cuts the y-axis at a different point.
- The graph of y = 3x – 1 cuts the y-axis at (0, –1).
- The graph of y = 3x cuts the y-axis at (0, 0).
- The graph of y = 3x + 1 cuts the y-axis at (0, 1).
- Changing the value of b shifts the graph upward or downward without changing its inclination.
📊 Comparison of the Given Equations
| Equation | Slope (a) | y-intercept (b) | Position of the Graph |
|---|---|---|---|
| y = 3x – 1 | 3 | –1 | Lowest |
| y = 3x | 3 | 0 | Middle |
| y = 3x + 1 | 3 | 1 | Highest |
💡 Reflection on the Role of ‘a’ and ‘b’
From the graphs, we conclude the following.
- Since the value of a is the same in all three equations, all the graphs have the same inclination.
- Equal values of a produce parallel straight lines.
- The value of b determines where the graph cuts the y-axis.
- Increasing b shifts the graph upward, while decreasing b shifts it downward.
- Changing b does not change the slope of the graph.
✅ Final Answer
- All three graphs are straight lines having the same slope.
- Since a = 3 for all the equations, the graphs are parallel to one another.
- The graphs cut the y-axis at different points because the values of b are different.
- Changing the value of b shifts the graph upward or downward without changing its slope.
- Therefore, a determines the inclination of the graph, while b determines the y-intercept.
📘 Key Concept Used
In the linear equation y = ax + b, the coefficient a determines the slope (inclination) of the graph, whereas b determines the point where the graph cuts the y-axis. If the value of a remains the same, changing b shifts the graph vertically without affecting its slope.
⚠ Common Mistake
Students often think that changing the value of b also changes the inclination of the graph. In fact, the slope remains the same; only the position of the graph shifts upward or downward.
🎯 Exam Tip
Whenever two or more equations have the same value of a, first check their values of b. Equal values of a produce parallel graphs, while different values of b change only the y-intercepts.
🧠 Graph Memory Trick
Same a
⇒
Parallel Graphs
Increase b
⇒
⬆ Graph Shifts Up
Decrease b
⇒
⬇ Graph Shifts Down
Question 1 (v)
Draw the graphs of the following sets of lines. In each case, reflect on the role of ‘a’ and ‘b’.
y = -2x – 3, y = -2x, y = 2x + 3
📌 Given
y = ax + b
- a represents the slope (inclination) of the line.
- b represents the y-intercept.
- For the given equations, the values of a are -2, -2 and 2.
- The corresponding values of b are -3, 0 and 3.
🎯 To Find
- Draw the graphs of the given equations.
- Compare the graphs.
- Reflect on the role of a and b.
🟧 Step 1 : Prepare the Tables of Values
Choose suitable values of x and calculate the corresponding values of y for each equation. These ordered pairs will be plotted on the Cartesian plane to draw the graphs.
Table for y = -2x – 3
| x | -2 | -1 | 0 | 1 | 2 |
|---|---|---|---|---|---|
| y | 1 | -1 | -3 | -5 | -7 |
Table for y = -2x
| x | -2 | -1 | 0 | 1 | 2 |
|---|---|---|---|---|---|
| y | 4 | 2 | 0 | -2 | -4 |
Table for y = 2x + 3
| x | -2 | -1 | 0 | 1 | 2 |
|---|---|---|---|---|---|
| y | -1 | 1 | 3 | 5 | 7 |
Using the above tables, plot the ordered pairs on graph paper and draw the three straight-line graphs. These graphs will help us understand how the values of a and b together affect the slope, direction and position of a linear equation.
🟧 Step 2 : Plot the Points and Draw the Graphs
Plot the ordered pairs obtained from the above tables on the Cartesian plane. Join the corresponding points using a ruler to obtain straight-line graphs and extend each line in both directions.
The graphs of y = –2x – 3, y = –2x and y = 2x + 3 are shown below.
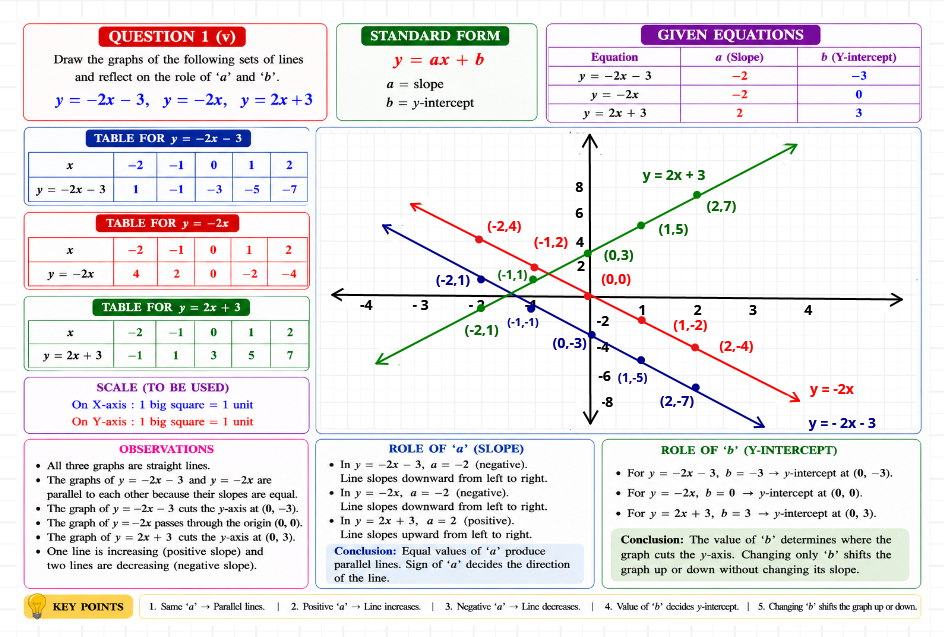
Figure: Graphs of y = –2x – 3, y = –2x and y = 2x + 3 showing how changing the values of a and b affects the direction, slope and position of the graphs.
🟧 Step 3 : Observe and Compare the Graphs
From the graphs, we observe the following.
- All three graphs are straight lines.
- The graphs of y = –2x – 3 and y = –2x are parallel because they have the same slope (a = –2).
- The graph of y = 2x + 3 is not parallel to the other two because its slope is different (a = 2).
- The graphs of y = –2x – 3 and y = –2x slope downward from left to right.
- The graph of y = 2x + 3 slopes upward from left to right.
- The three graphs cut the y-axis at (0, –3), (0, 0) and (0, 3) respectively.
- Changing the value of b shifts the graph vertically without changing its slope.
📊 Comparison of the Given Equations
| Equation | Slope (a) | Y-intercept (b) | Nature of Graph |
|---|---|---|---|
| y = –2x – 3 | –2 | –3 | Decreasing, Parallel |
| y = –2x | –2 | 0 | Decreasing, Parallel |
| y = 2x + 3 | 2 | 3 | Increasing |
💡 Complete Reflection on the Linear Equation y = ax + b
From the graphs, we conclude the following.
- The value of a determines the slope and direction of the graph.
- Positive a produces an increasing graph, whereas negative a produces a decreasing graph.
- Equal values of a produce parallel straight lines.
- The value of b determines the y-intercept of the graph.
- Changing b shifts the graph upward or downward without changing its slope.
- Together, the values of a and b completely determine the position and appearance of the graph of a linear equation.
✅ Final Answer
- The graphs of y = –2x – 3 and y = –2x are parallel because they have the same slope (a = –2).
- The graph of y = 2x + 3 is not parallel to the other two because its slope is different (a = 2).
- The graphs cut the y-axis at (0, –3), (0, 0) and (0, 3) respectively.
- The value of a determines the slope and direction of the graph, whereas the value of b determines the y-intercept.
- Together, the values of a and b completely determine the position and shape of the graph of a linear equation.
📘 Key Concept Used
For a linear equation y = ax + b, the coefficient a controls the slope and direction of the graph, while the constant b determines the point where the graph cuts the y-axis. Graphs having the same value of a are parallel, whereas changing only b shifts the graph vertically without changing its inclination.
⚠ Common Mistake
Students often think that two graphs with different y-intercepts cannot be parallel. Actually, if the value of a is the same, the graphs are always parallel, regardless of the value of b. Also, remember that changing b does not change the slope of the graph.
🎯 Exam Tip
Whenever you compare linear equations, first compare the values of a. If they are equal, the graphs are parallel. Then compare the values of b to identify the y-intercepts and determine whether the graph shifts upward or downward.
🧠 Exercise 2.6 Memory Trick
a decides the Slope 📈
Positive a → Graph rises ↗
Negative a → Graph falls ↘
Same a → Parallel Lines ║
b decides the Y-intercept
Increase b → Graph shifts Up ⬆
Decrease b → Graph shifts Down ⬇
🎯 What Have We Learned in Exercise 2.6?
Represent linear equations accurately on the Cartesian plane.
Prepare tables of values and plot ordered pairs correctly.
Understand how a and b affect the graph of y = ax + b.
Identify parallel lines and observe how different linear equations change the graph.
❓ Frequently Asked Questions (FAQs)
Find answers to the most common questions students ask while studying Class 9 Maths Chapter 2 Exercise 2.6 Solutions.
1. What is a linear relationship?
A linear relationship is a relationship between two variables that can be written in the form y = ax + b. When represented on a graph, it always forms a straight line.
2. Why do we prepare a table of values before drawing a graph?
A table of values helps us calculate the corresponding values of x and y. These ordered pairs are then plotted on the Cartesian plane to draw the graph accurately.
3. How many points are required to draw a straight-line graph?
Mathematically, two distinct points are enough to draw a straight line. However, in Class 9 CBSE examinations, plotting at least three or four correct points is recommended to verify accuracy.
4. What is meant by an ordered pair?
An ordered pair is written as (x, y). It represents the coordinates of a point on the Cartesian plane, where the first value shows the position on the x-axis and the second value shows the position on the y-axis.
5. What does the slope of a graph represent?
The slope tells us how rapidly the value of y changes with respect to x. A positive slope rises from left to right, while a negative slope falls from left to right.
6. What is the y-intercept of a linear graph?
The y-intercept is the point where the graph cuts the y-axis. In the equation y = ax + b, the value of b represents the y-intercept.
7. Why do some linear graphs become parallel?
Two linear graphs are parallel when they have the same value of a (same slope) but different values of b. They never intersect because their inclination remains the same.
8. What are the common mistakes students make while drawing graphs?
Common mistakes include choosing an incorrect scale, plotting coordinates in the wrong order, joining the points with a curve instead of a straight line, forgetting to label the axes, and not extending the line properly.
9. Why is Exercise 2.6 important for CBSE Class 9 Maths?
Exercise 2.6 develops graph-drawing skills and helps students understand linear equations visually. These concepts are essential for coordinate geometry, linear equations, and higher Mathematics in future classes.
10. How can I improve my graph-drawing skills?
Practice preparing tables of values, plot the points carefully using a suitable scale, use a ruler to draw straight lines, and always verify that every plotted point satisfies the given linear equation.
📚 Continue Learning
🔗 Useful Resources
Explore these official educational resources for authentic CBSE and NCERT study materials.
Need Personal Guidance in Maths?
Join Newton Study Point for concept-based Maths coaching by an experienced teacher. Small batches, individual attention, regular tests, and complete CBSE exam preparation for Classes 8, 9, 10, 11 & 12.
📞 Call Now: 8447002272 💬 WhatsApp📍 Newton Study Point • Ankur Vihar, Ghaziabad

Rakesh Kumar Singh
Founder, Maths Gurukulam & Newton Study Point
Teaching CBSE Mathematics Since 2006
These Class 9 Maths Chapter 2 Exercise 2.6 Solutions are carefully prepared according to the latest NCERT Ganita Manjari (2026) and the CBSE curriculum. Every solution follows a clear, step-by-step approach designed to strengthen conceptual understanding, improve problem-solving skills, and help students perform confidently in school and board examinations.